Plot feature (3D)
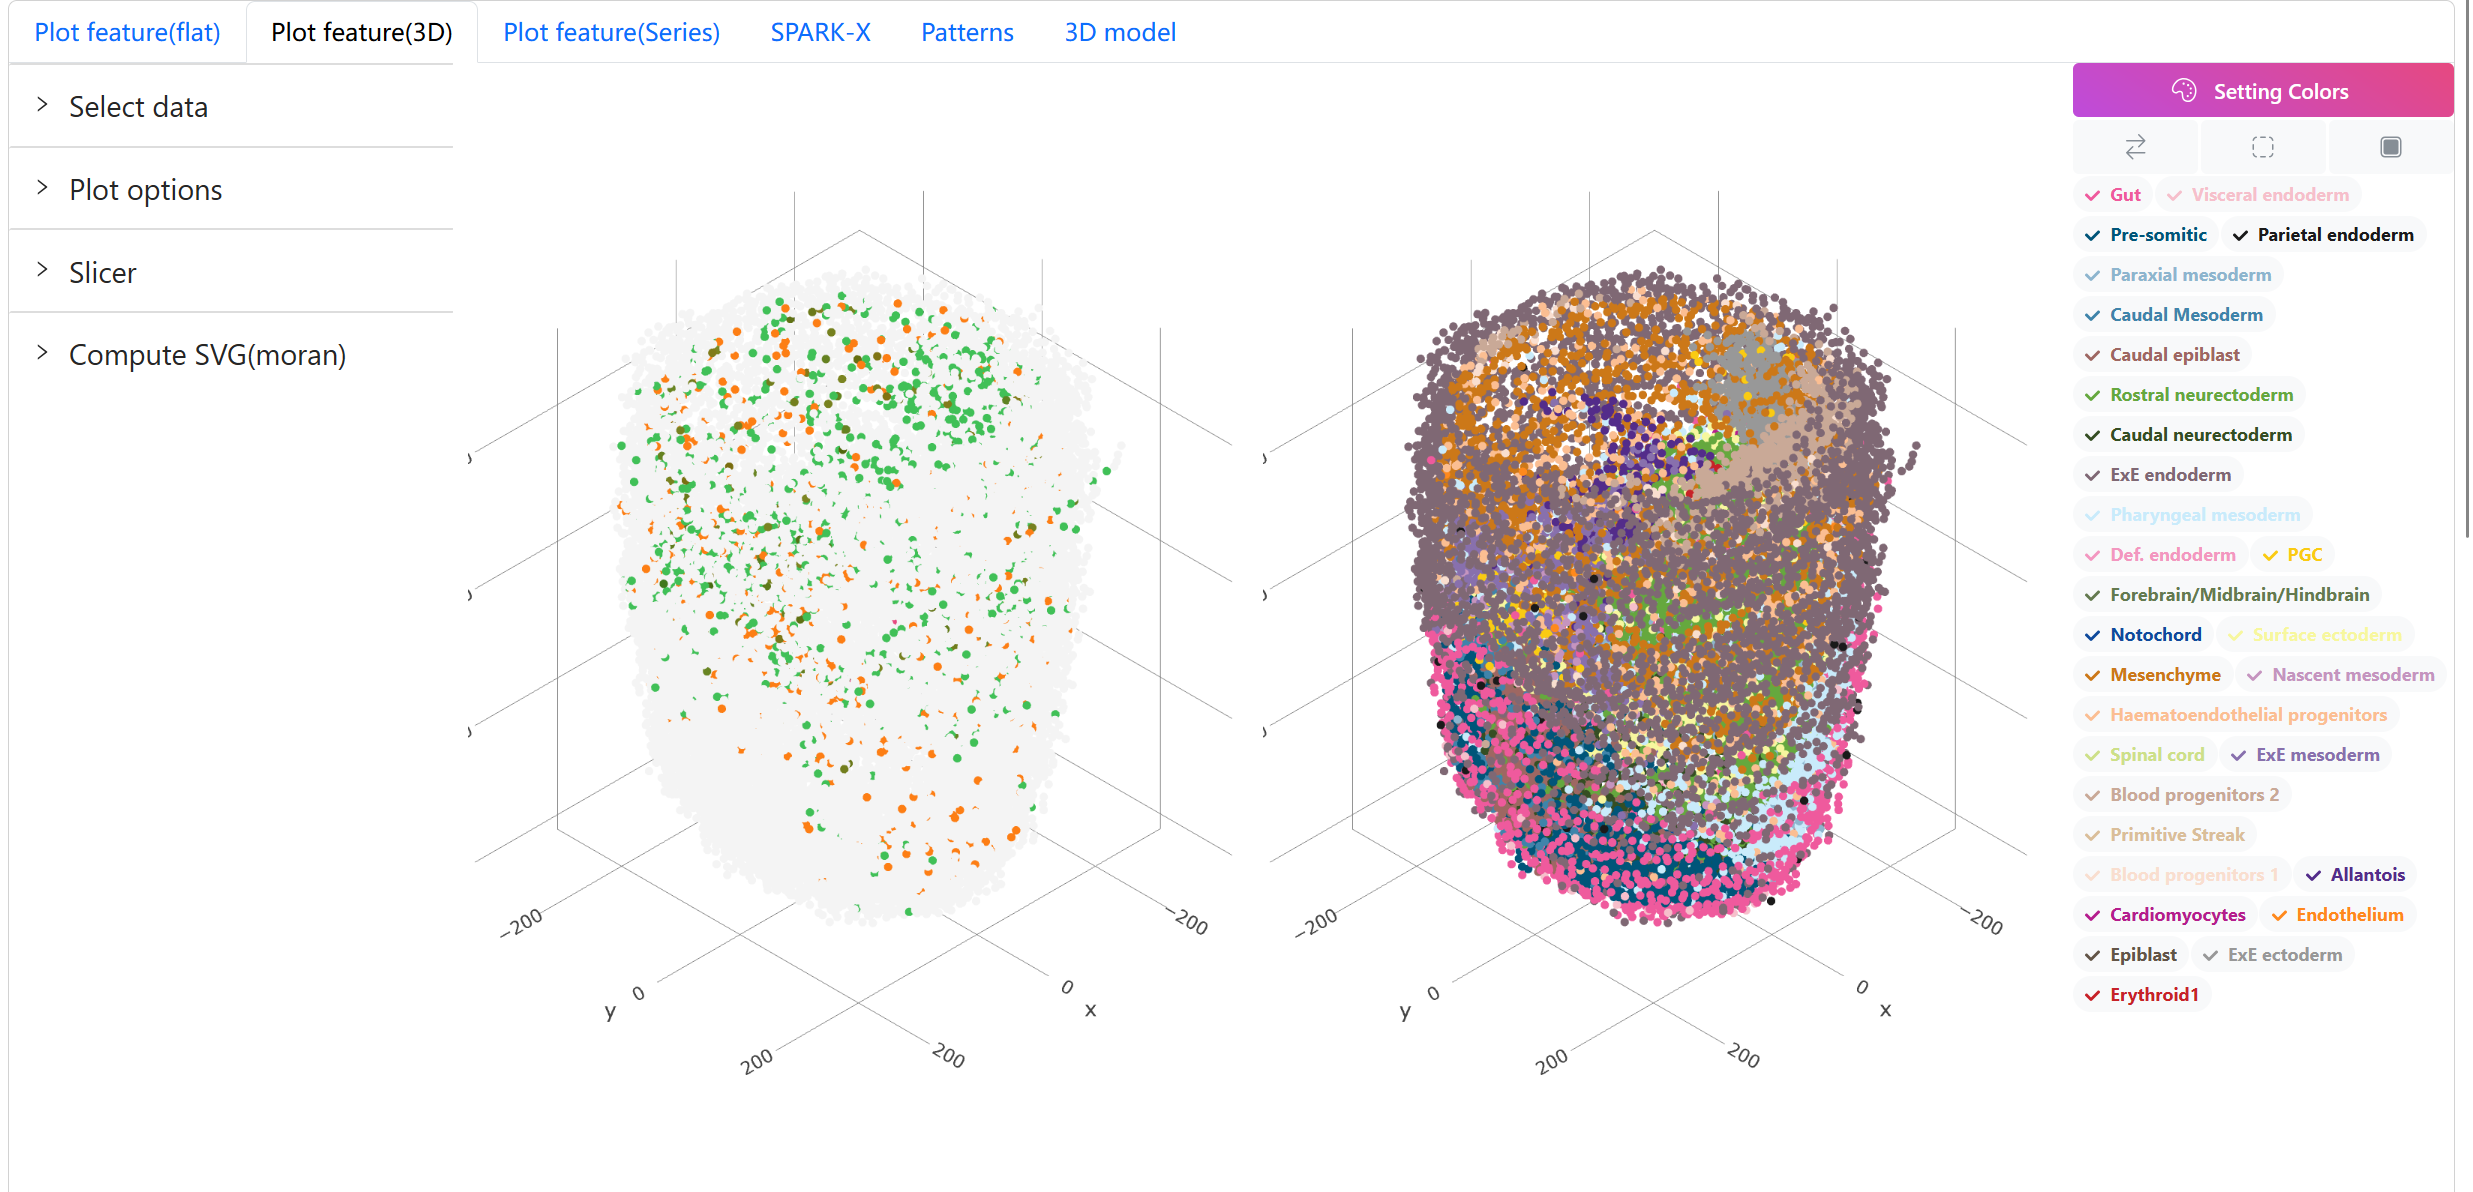
In this tab the digital embryos in a 3D coordinates system are displayed, and they are formed by registering and aligning multiple layers of slices.
On the left is a accordion that contains some functions and configuration items. On the middle are two 3D scatter with synchronized viewing angles, which show gene expression and cell-type annotation respectively. On the right is a cell-type selector.
Accordion on the left
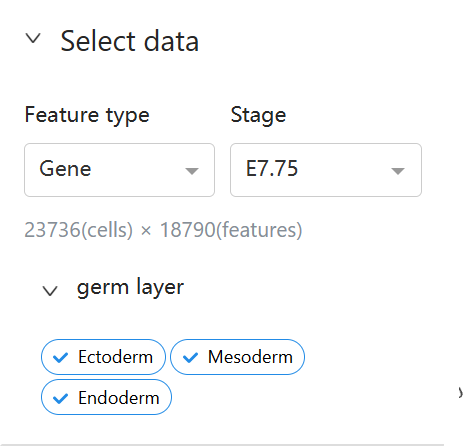
- Select data
Use Select data to choose embryo in your interested stage, and the germ layer could also be specified to show part of the embryo.
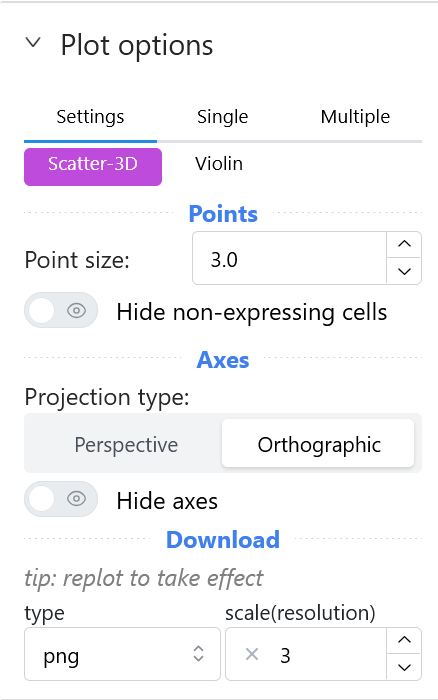
- Plot options
There are 3 subtabs in the Plot options, they are Settings, Single and Multiple respectively.
-
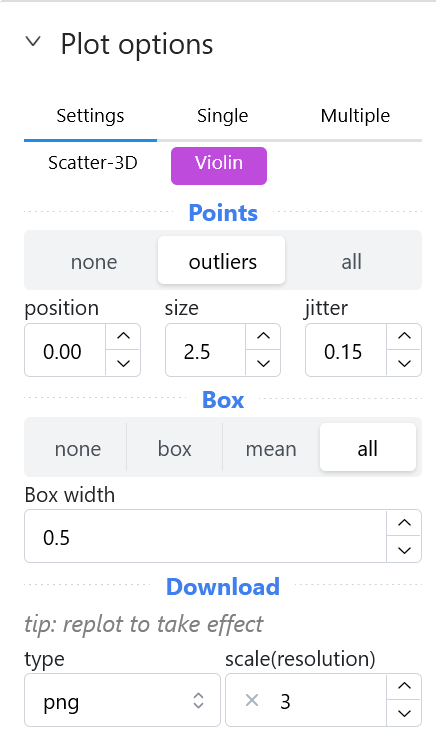
settings
In
settingsyou could configure the drawing options, which may be useful for generating the image you want.
-
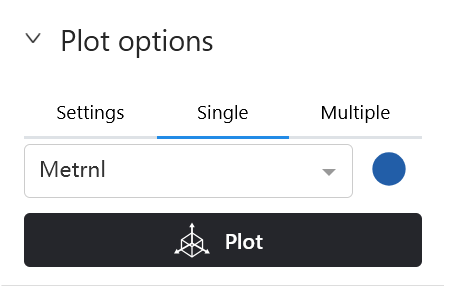
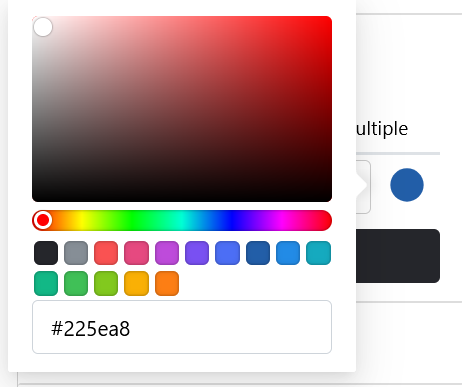
Single
In
Singleyou could choose your interested gene to plot on the 3D scatter. By clicking the color dot on the right, you could specify drawing color of the gene.
-
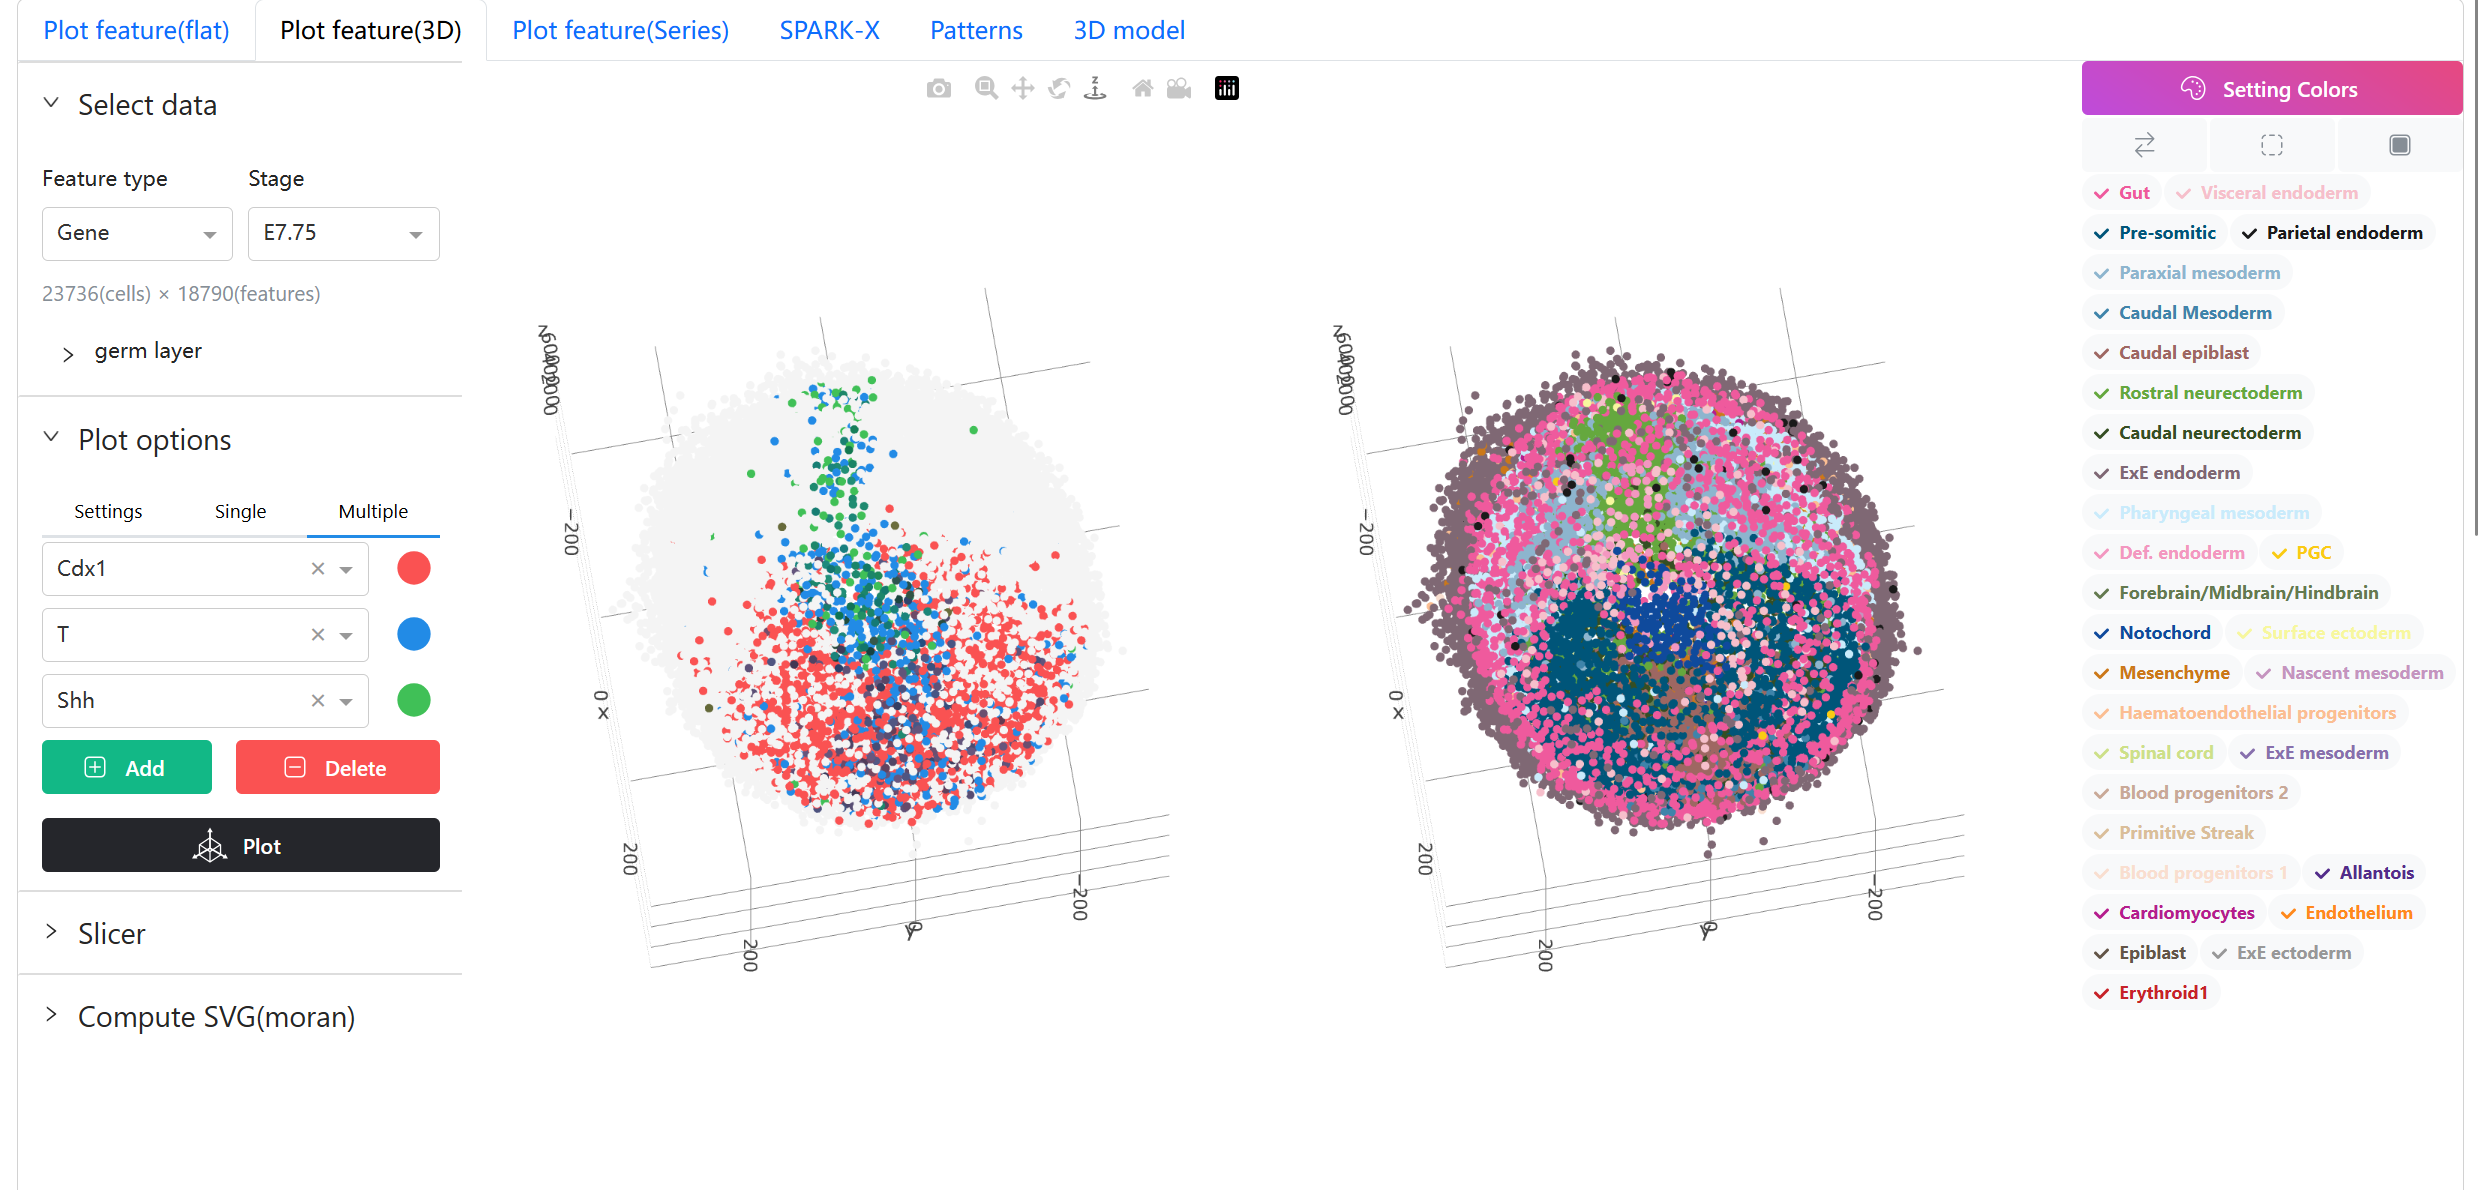
Multiple
In
Multiple, several genes can be displayed together on one 3D scatter. Color of each cell is assigned by mixing the specified color of selected gene, based on the expressing proportion in the cell.
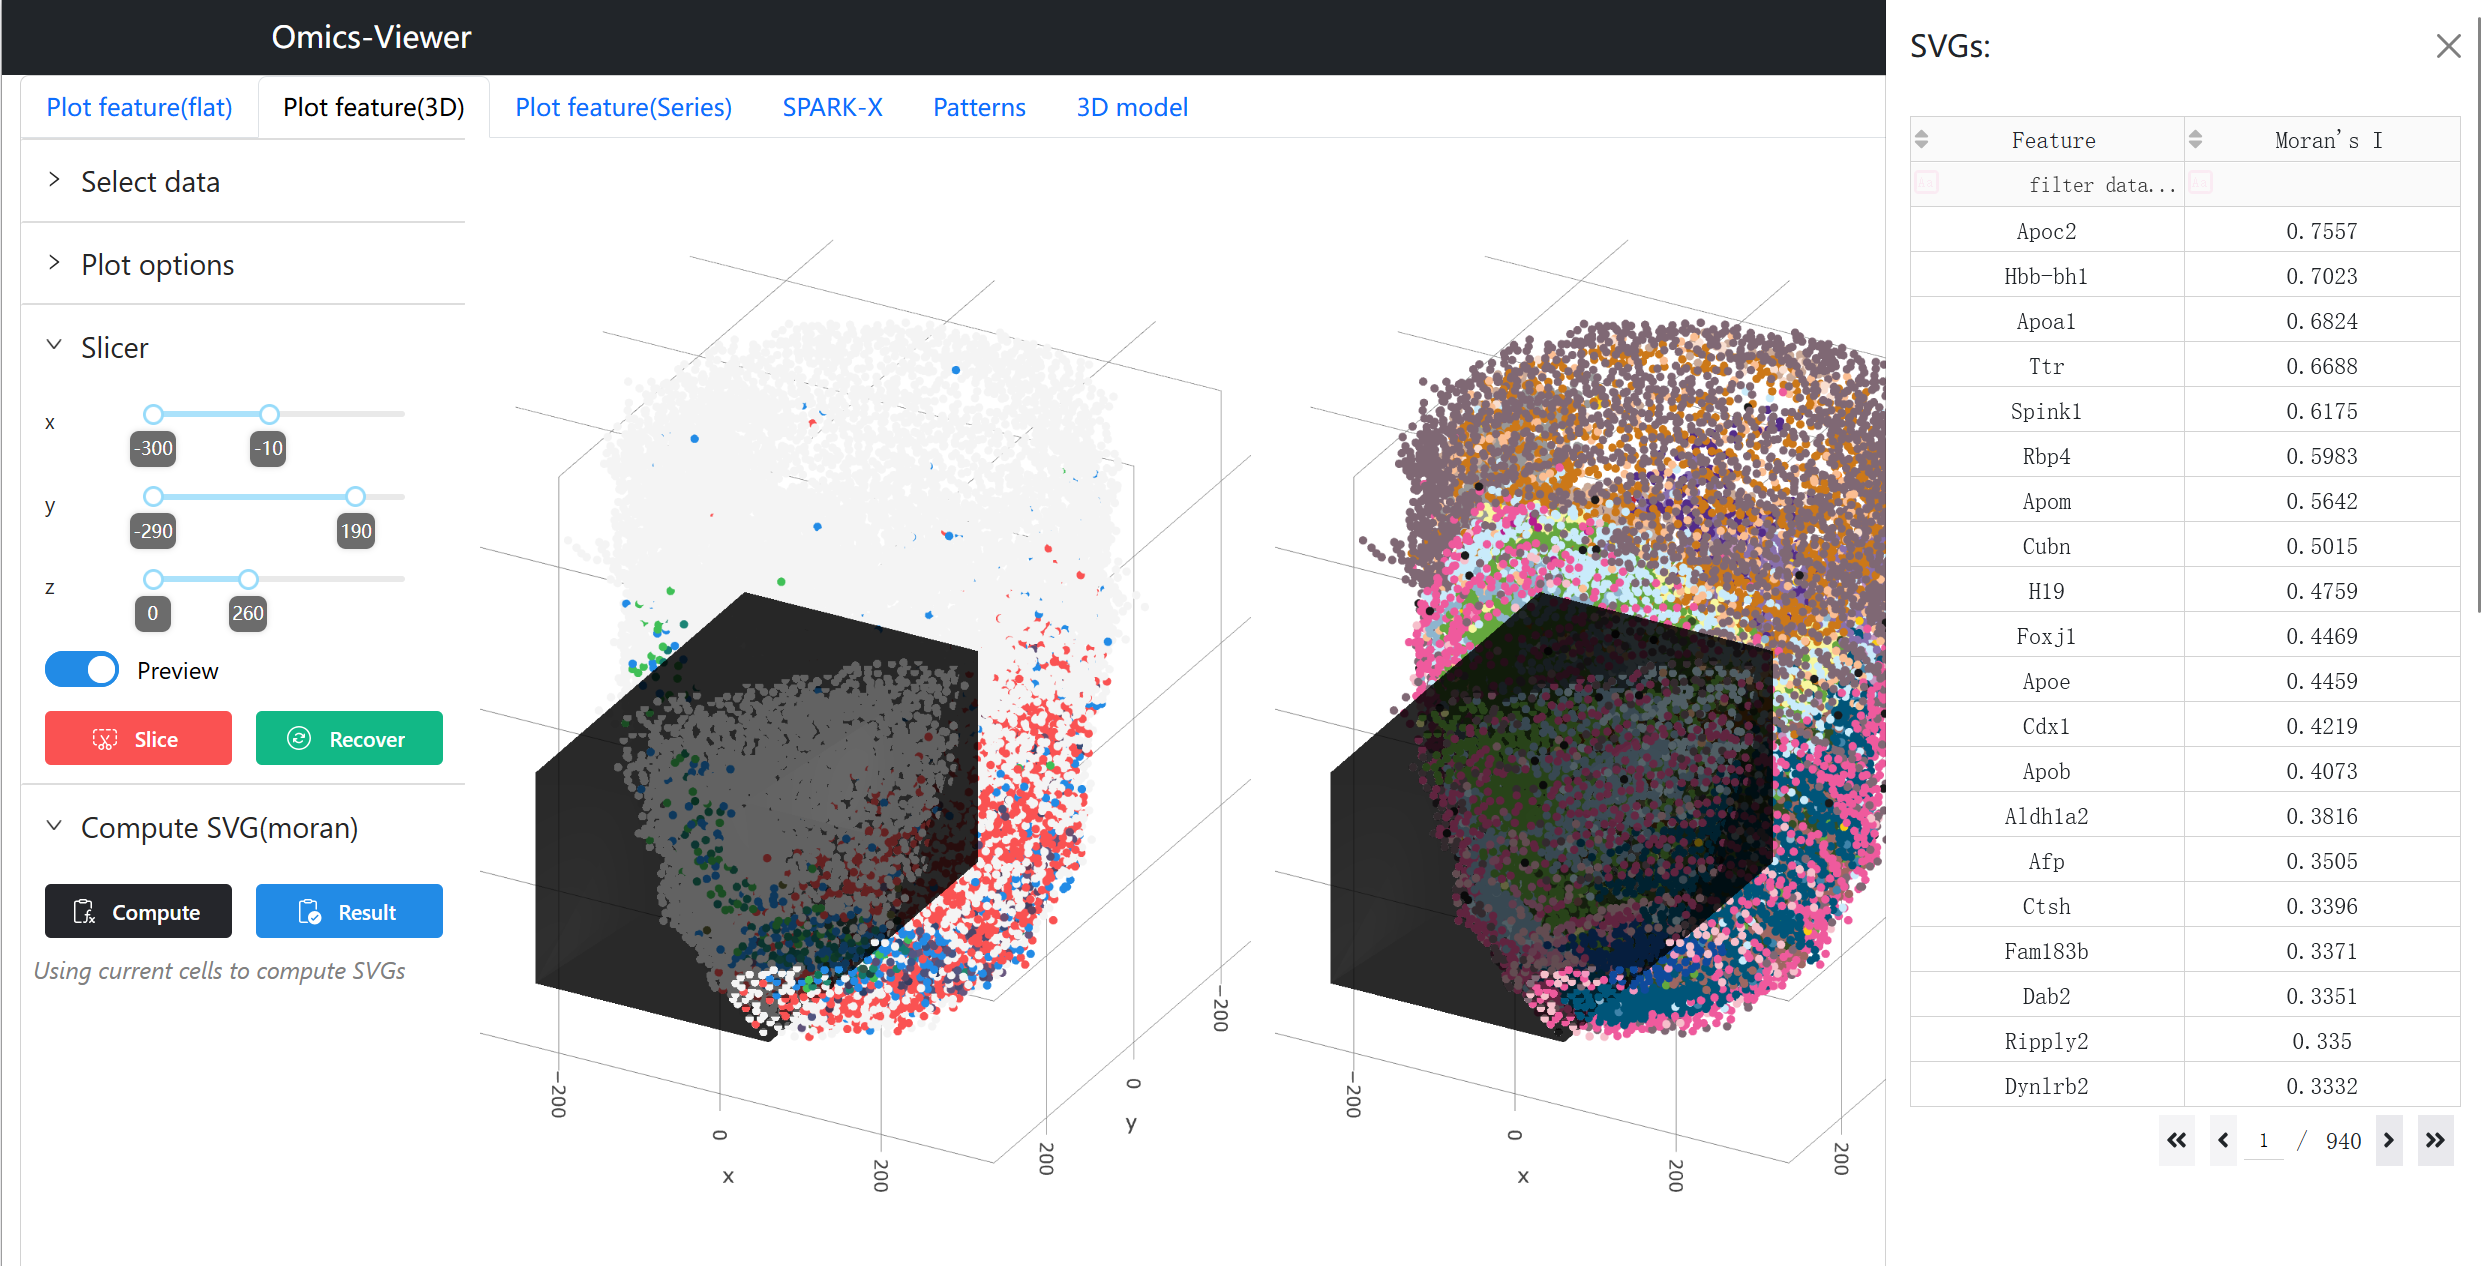
- Slicer
Slicer is used to subset part of the embryo. Check the Preview switch will show a black box covering the range that cells in which will be preserved.
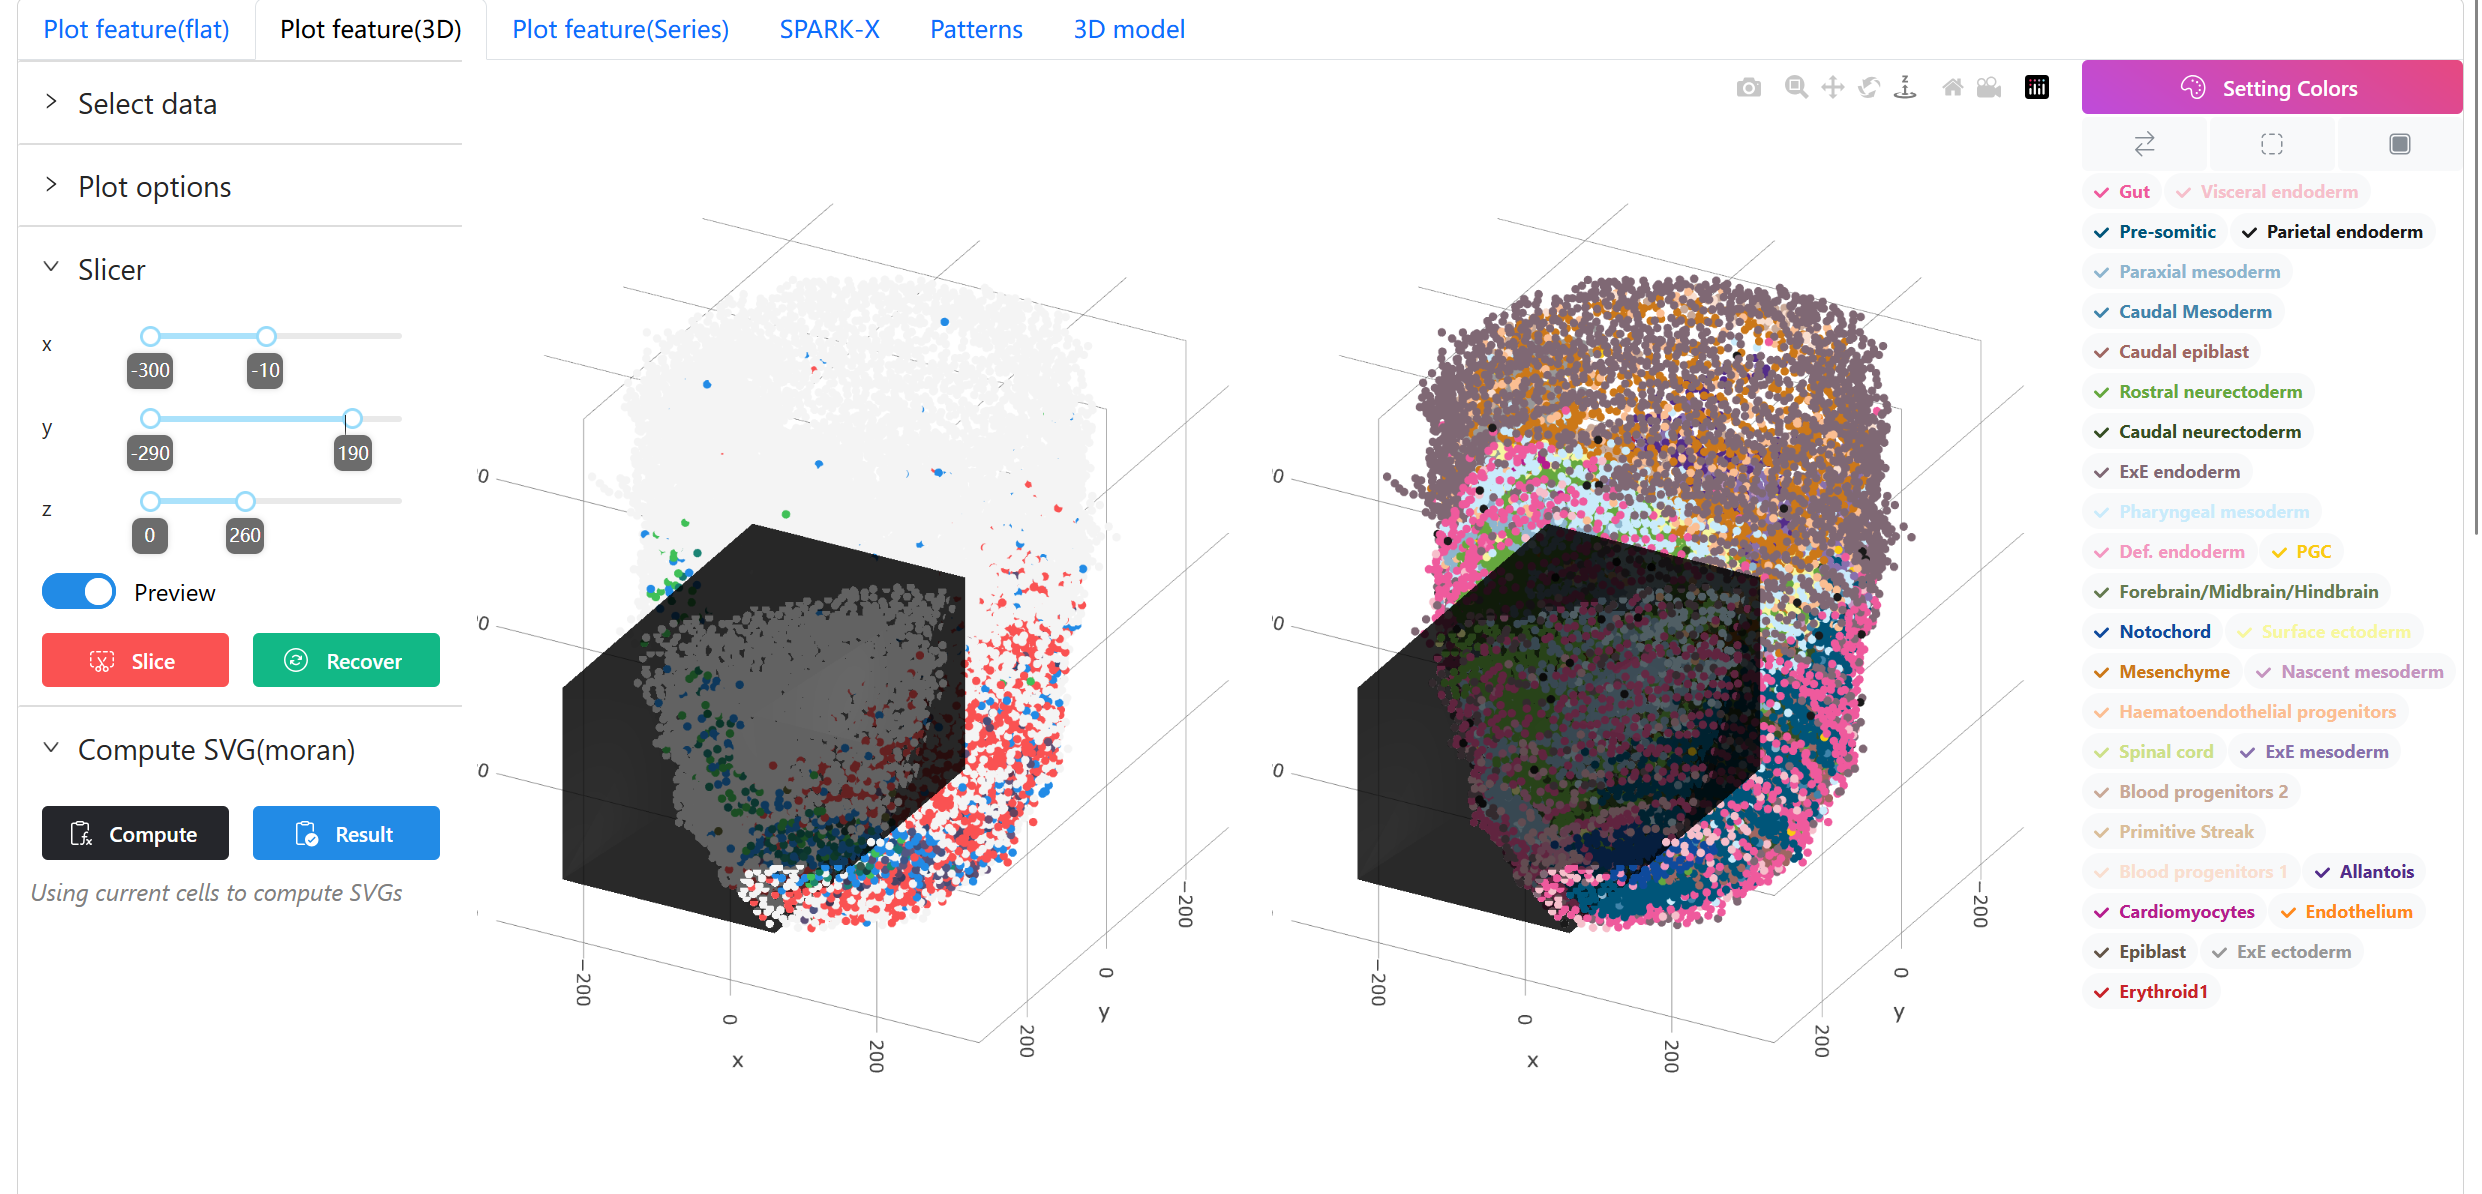
- Compute SVG (Moran)
It's an analysis tool to find spatially variable genes in current cells ( filtered by germ layer, Slicer and cell-type selector). Results will be preserved in a drawer, and can be checked again by pressing Result button.