Plot feature (Series)
In this tab you could plot series of genes at a time, like:
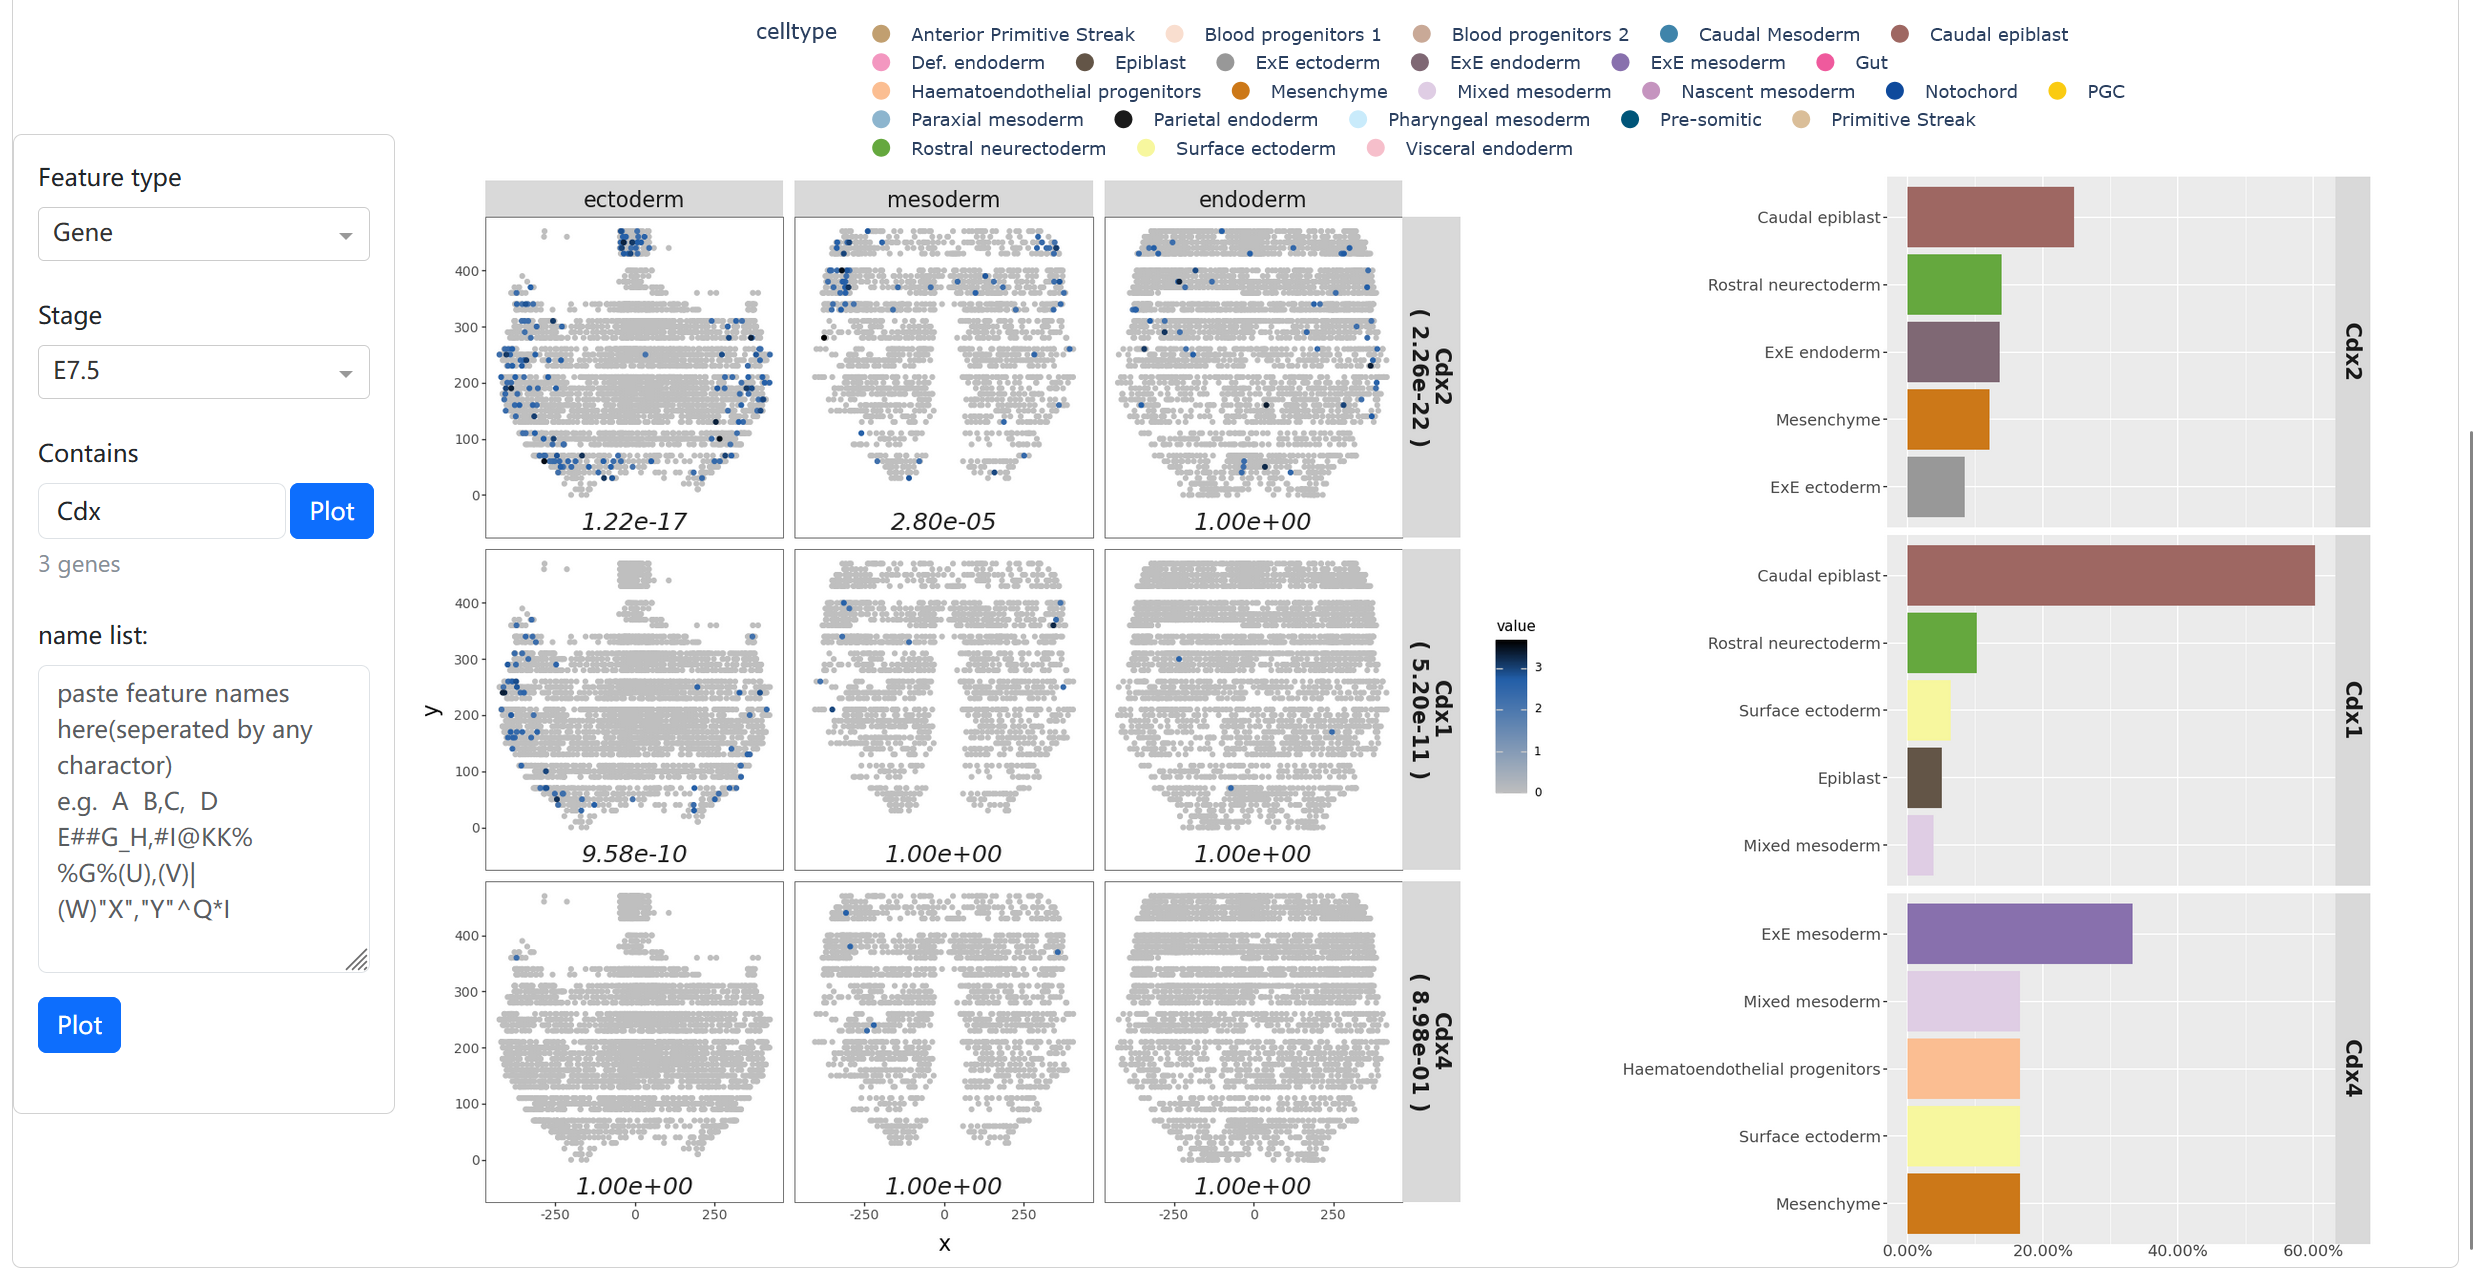
On the left is a figure of the genes' expression on flatten coordinate, and on the right is the proportion of cell types of cells with gene expression.
There are two ways to tell the server which genes need to be plotted.
Containsinput box
There are many genes with similar functions that share the same prefix, you could type in the prefix into the Contains input box and plot these genes.
Text below the input box shows will how many genes will be drawn. Please don't draw too many genes at once.
Name listtext area
Or you can put all the genes you want to plot into the Name list text area, which can be separated by Spaces, line breaks, commas, etc.